The new report “State of the Global Climate 2025” published by the World Meteorological Organization (WMO) confirms that the period 2015–2025 was the warmest decade on record and that 2025 was among the three warmest years on record, with a global mean temperature anomaly of about +1.43 °C relative to the 1850-1900 pre-industrial average
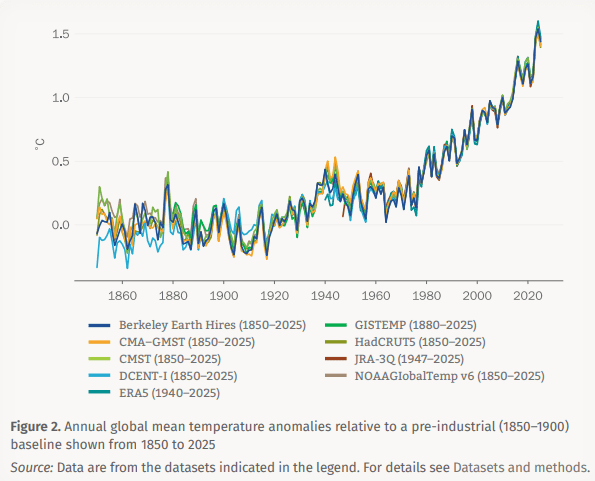
The report analyses several key indicators: global temperature, greenhouse gas concentrations, ocean heat, sea level and ice conditions, which together provide an up-to-date snapshot of the state of the planet’s climate.
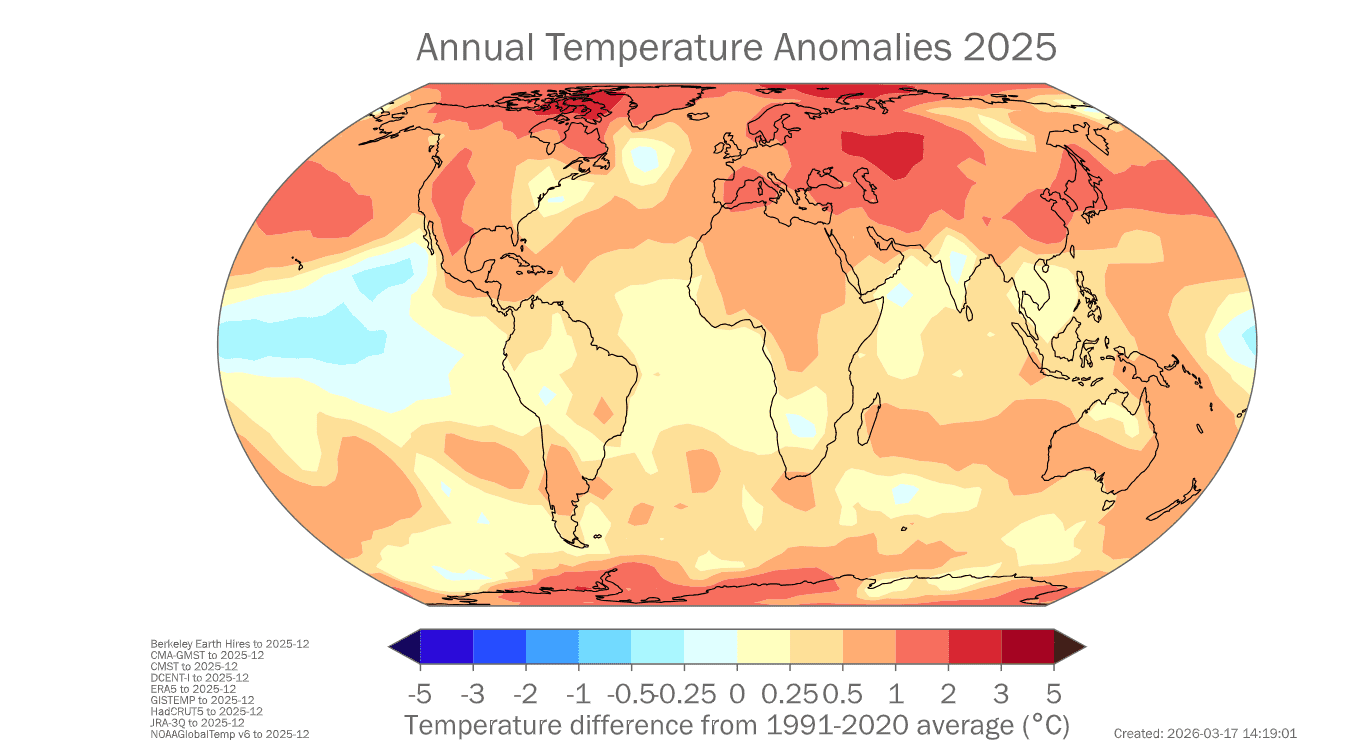
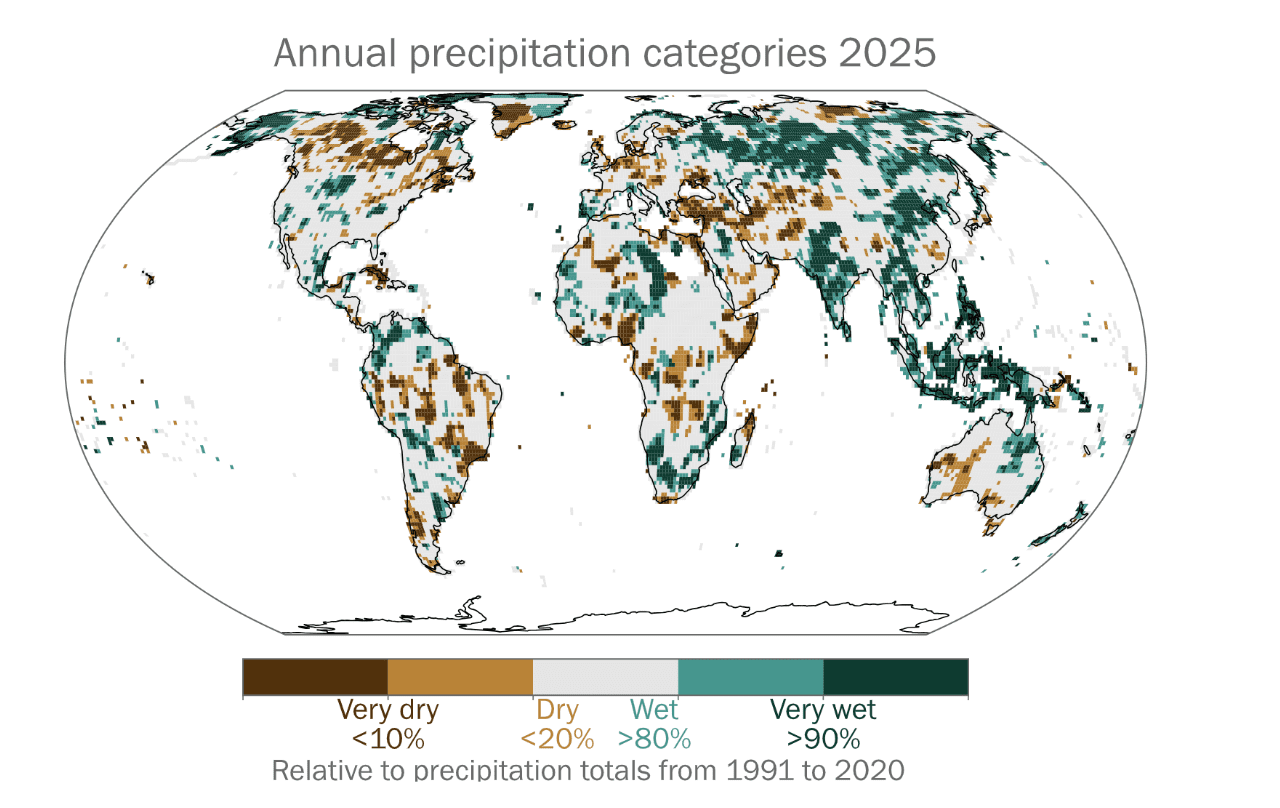
Global temperature and precipitation patterns: a map of climate anomalies in 2025
An important point emphasized in the 2025 Climate Report is that global warming is not distributed evenly across the planet. Indeed, some regions are experiencing particularly marked temperature anomalies. The report presents detailed maps and analyses of temperature anomalies and changes in precipitation.
In 2025, several areas of the world recorded significant positive temperature anomalies, including:
-
- Greenland
- Northern Canada
- Western Europe
- Fennoscandia
- The Mediterranean region
- Many regions of Asia
Precipitation in 2025 also showed significant regional anomalies. Several areas of the planet experienced conditions that were significantly drier than the climatic average, particularly south-west Asia, parts of eastern and central Africa, certain regions of Europe and parts of South America. In particular, North-West Africa continues to experience a multi-year drought, although with a partial improvement towards the end of the year.
Conversely, above-average rainfall was observed across much of South and South-East Asia, the Sahel, parts of Southern Africa, the northern Andes and various areas of North America. In India, for example, the monsoon began earlier than usual.
In some regions of the Pacific, rainfall patterns were influenced by the cold phase of the El Niño-Southern Oscillation system, known as La Niña, which tends to produce characteristic patterns of rain and drought in various parts of the world.
The role of climate variability: El Niño and La Niña
Year-to-year variations are also influenced by natural climate variability, in particular by the phenomenon known as the El Niño-Southern Oscillation (ENSO).
-
- El Niño, associated with warmer ocean temperatures in the equatorial Pacific;
- La Niña, characterised by slightly cooler ocean conditions.
The strong El Niño episode between 2023 and 2024 contributed to the record temperatures recorded in those years. In 2025, however, the system shifted to the opposite phase, La Niña, contributing to a slight relative cooling of global temperatures compared to the peak in 2024.
Greenhouse gases and energy storage in the climate system
Atmospheric concentrations of greenhouse gases continue to rise and are the main driver of global warming. Levels of carbon dioxide, and nitrous oxide remain at record highs in modern records.
The global concentration of CO₂ has reached approximately 423.9 ppm, equivalent to 152% of pre-industrial levels, confirming the upward trend of recent years.
Methane (CH₄) has reached 1942 ± 2 ppb, approximately 266% of pre-industrial levels; whilst nitrous oxide (N₂O) has reached 338.0 ± 0.1 ppb, equivalent to 125% of pre-industrial levels. These gases trap heat in the atmosphere and are the main drivers of the intensification of the greenhouse effect.
To better describe this process, the report also introduces a new indicator increasingly used in climate research: the Earth Energy Imbalance. This parameter measures the difference between the energy the planet receives from the Sun and the energy it manages to radiate into space. When incoming energy exceeds outgoing energy, the climate system accumulates heat. Much of this excess energy is absorbed by the oceans, which act as a huge thermal reservoir for the planet.
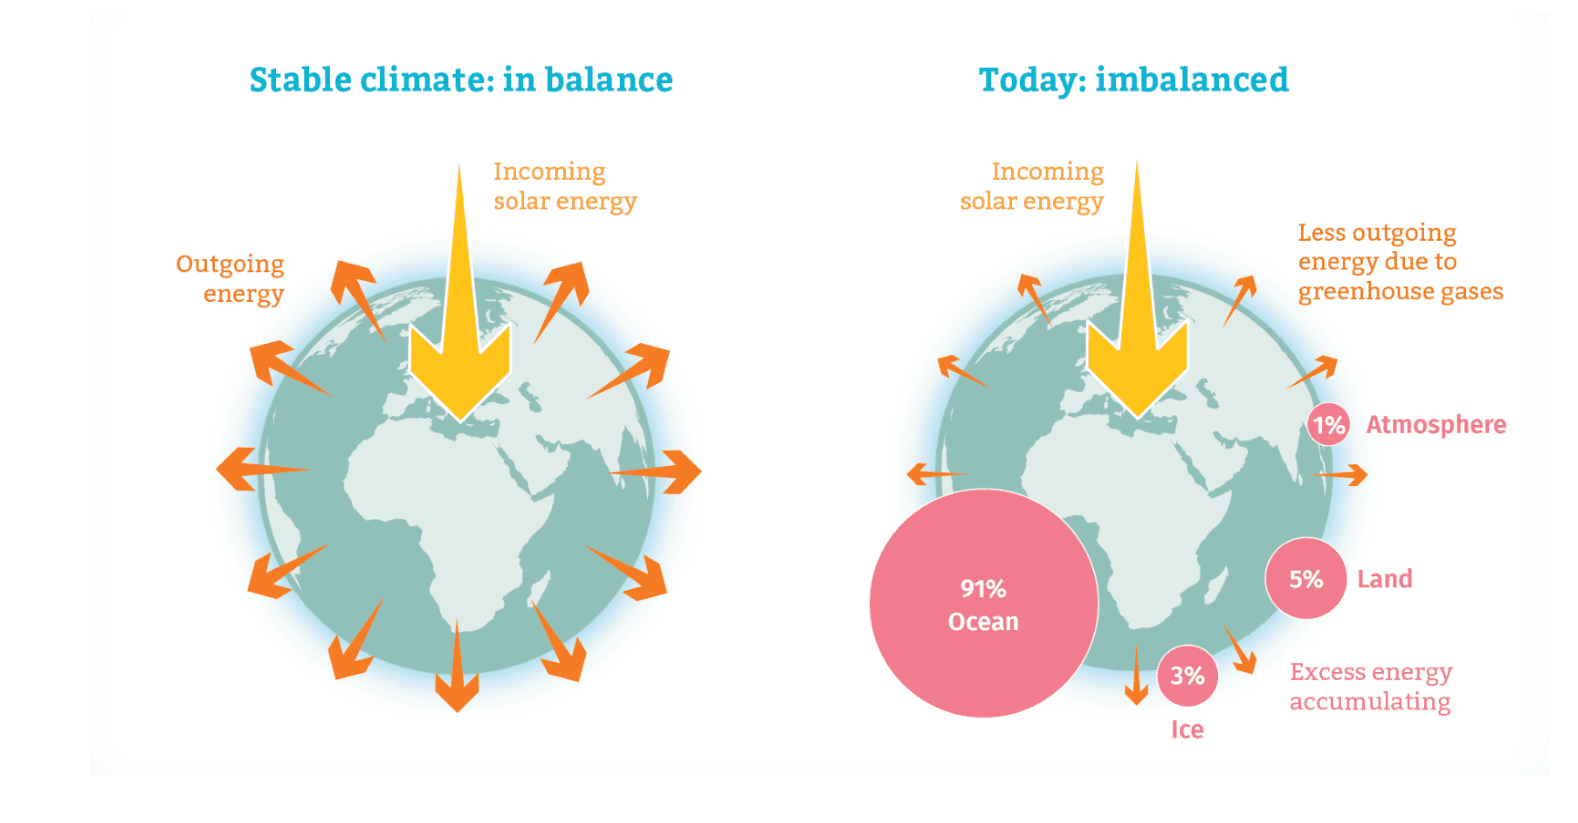
Warming oceans
The oceans absorb more than 90% of the excess heat generated by global warming. In 2025, the global ocean heat content (in the upper 2000 meters of depth) reached a new record, exceeding the level recorded in 2024 by about 24 zettajoules (±16 ZJ).
Ocean warming contributes to several climate phenomena, including the intensification of storms, marine heatwaves, and sea level rise.
At the same time, the absorption of CO₂ continues to alter marine chemistry: about 29% of the carbon dioxide emitted by human activities between 2015 and 2024 was absorbed by the oceans, modifying the carbonate system of seawater. As a result, the average pH of the ocean surface has decreased by about -0.017 units per decade since 1985, highlighting a progressive process of acidification with potential impacts on marine ecosystems.
Rising sea levels
Ocean levels remained close to the record highs observed in 2024. Between 2023 and 2024, a particularly rapid increase of about 5 mm was recorded, also linked to the strong El Niño event that characterized that period. In 2025, with the transition toward La Niña conditions, the rise was more moderate, but sea levels remained very high.
Overall, by the end of 2025 the global mean sea level was about 11 cm higher than in 1993, the year when satellite observations began. Moreover, the rate of increase is accelerating:
-
- 1993–2011: about 2.65 mm per year
- 2012–2025: about 4.75 mm per year
This increase is mainly due to two factors: the thermal expansion of water, which expands as it warms, and the melting of glaciers and ice sheets. Satellite measurements show that the average ocean level has reached values close to the highest levels recorded in recent decades.
Shrinking Glaciers and Sea Ice
The report also highlights a continuing decline in glacier mass and sea ice extent.
In recent years, Arctic sea ice extent has remained well below the historical average, whilst Antarctic sea ice has shown particularly low values compared with observations over the last few decades.
In 2025, the average annual extent of Arctic sea ice was 10.10 million km², the lowest or second-lowest (based on observational data) ever recorded in the satellite era.
The impacts of climate during 2025
Overall, the data and indicators analyzed in the 2025 climate report show that global temperatures, ocean heat content, ice loss, and sea level rise all point to increasingly rapid changes in the climate system.
Consequently, these trends reinforce the urgent need for coordinated action at the global level. According to the World Meteorological Organization, these large-scale changes in the Earth system are producing cascading effects on ecosystems and human societies. In particular, the impacts are most evident in the most vulnerable regions, where extreme events, droughts, or floods can worsen food insecurity, the loss of livelihoods, and population displacement.Therefore, the report emphasizes that continuous monitoring of climate indicators is essential not only for understanding the evolution of the climate but also for strengthening adaptation and resilience strategies.
Future prospects: adaptation and sustainable collaboration
The data presented in the 2025 report show that climate is changing rapidly. As a result, strengthening mitigation and adaptation strategies has become increasingly urgent. Reducing emissions, protecting ecosystems, managing resources sustainably, and promoting technological innovation will be key elements in addressing climate challenges in the coming decades.
At the same time, collaboration between institutions, local communities, organizations, and companies is essential. In addition, digital technologies can play an important role. They help coordinate field activities, improve the collection of environmental data, and support the management of operations in complex or remote environments. Brochesia has long been committed to helping companies achieve their sustainability goals. The augmented reality software developed by Brochesia allows businesses to optimize internal processes and significantly reduce the need for physical travel. Through remote collaboration and augmented reality tools, organizations can manage operational activities, technical assistance, and training from a distance. Consequently, this reduces business trips and travel.
Moreover, this approach generates concrete benefits. On the one hand, it improves productivity and accelerates business processes. On the other hand, it contributes to reducing CO₂ emissions and supports more efficient and sustainable operating models. These software solutions can play a key role in the energy transition, especially in the renewable energy sector. For example, they can support maintenance, monitoring, and remote technical assistance. More details are available in this in-depth article on augmented reality applied to the energy sector.
Finally, by integrating these technologies into everyday processes, companies can build an ecosystem where digital innovation and environmental sustainability progress together. At the same time, this approach strengthens organizational resilience and market competitiveness.
To learn how to make your activities more sustainable and low-emission, contact us.